English

")

Following on from our previous publication on Overall Equipment Effectiveness (OEE) and Total Effective Equipment Performance (TEEP) some people wanted to know some more about this useful number parameters and what would constitute some likely numbers to shoot for.
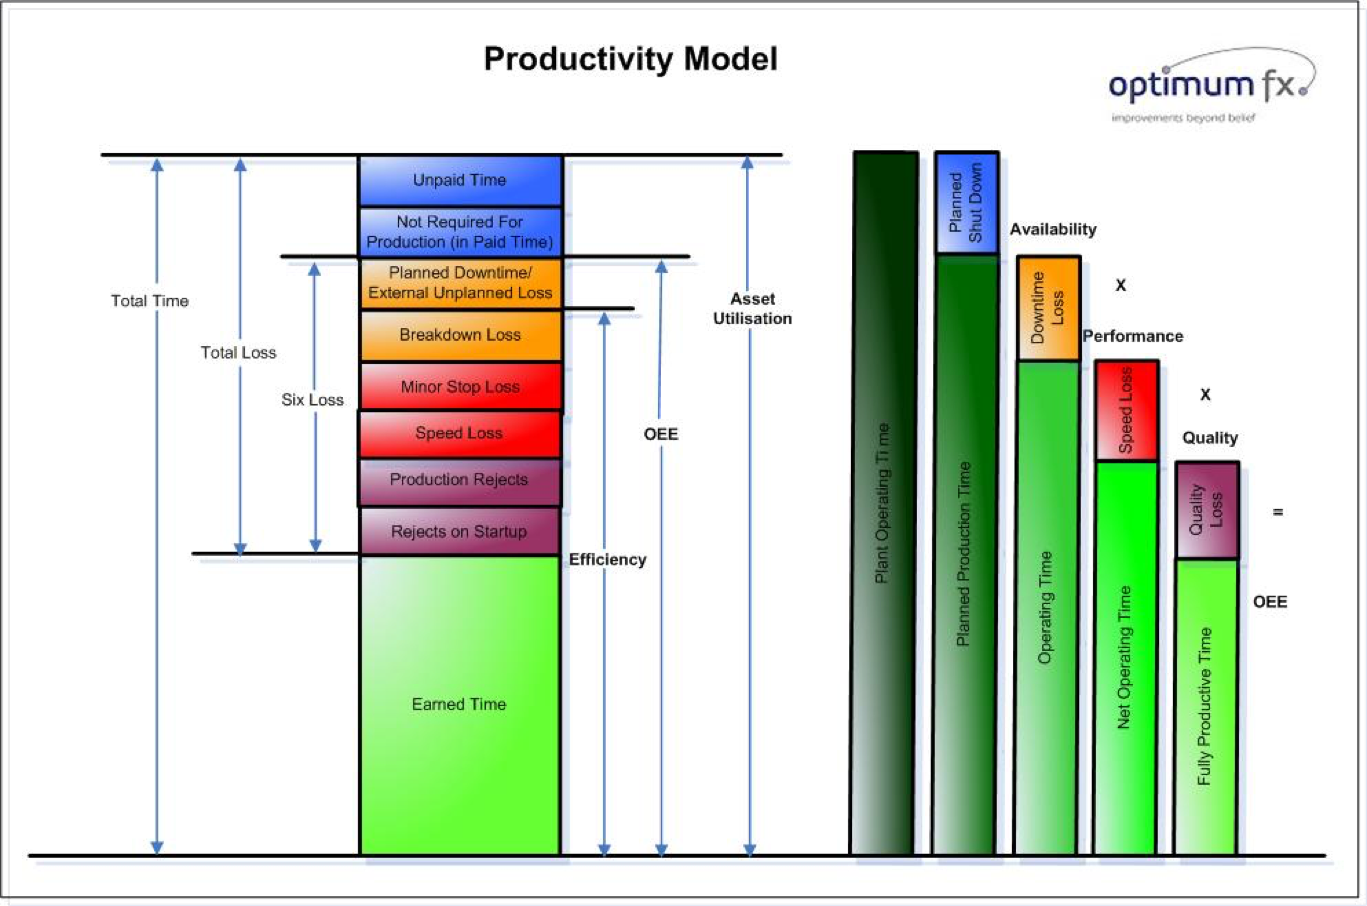
Let us start off with an easy to interpret graphical interpretation of the parameter as a recap and to ensure we are all on the same page:

As can be seen it all looks quite simple and straightforward. So, what could possibly go wrong? Well, it is important to realise that as with any amalgamating parameter such as the OEE or TEEP that reverse variability may be masked. What we mean by this is that say your Availability is 80% and your Performance is 50% that for a constant Quality you would not pick up when suddenly the Availability dropped to 50% whilst Performance shot up to 80%. One also needs to keep an eye on what is of critical underlying importance to you and your process.
What we mean by this say that for a constant Availability you could improve Performance by 10% but it would mean dropping Quality by 5%… At first glance –looking only at your OEE figure- that would sound OK… But now imagine that you are a surgeon and suddenly your loss of quality gets a completely different setting, right? In addition, it is worth noting that among the constituting parameters (Loading, Availability, Performance, Quality) there is not a direct link to cost. Never lose sight of that!!! If it costs 3 times the normal rate to get your factory to open in country Utopia on a Sunday, you need to consider whether bumping up your TEEP here is going to be compensated by the selling of the Widgets you are going to make on that day.
Another important issue never to lose sight of when computing your OEE is the data quality used to arrive at the figure. Whenever possible use automated date capturing. Ensure that you get consistent, repeatable data that is as much as possible free from any form of manipulation or triage. Consistency in data will increase the reliability of your OEE number and will prevent it from becoming an exercise in self-delusion or the catching of a yoyo. Now say that we keep an eye on that, what would be “good” numbers to aim for? Seiichi Nakajima who is the Japanese guru on Total Productive Maintenance (TPM) based on his experience put forward the following figures which he held to be a minimum to which all organizations should strive:
Availability: 90%
Performance: 95%
Quality: 99%
This, as a simple calculation will show, would bring the OEE already to a lofty 85%
When looking at these numbers it is important to realise that we are dealing here with factory or assembly based processes –meaning highly controlled and repeatable- and in a country at the pinnacle of industrial maturity at that.
In your average project environment, it is unlikely you will get your widget-contraption to run at an OEE at 85%. Then again… if you can, should you be content with that? And likewise, if you do the math and you find yourself at an OEE of 50% do you think that setting a target of 85% by next week is going to get your team al revved up and fully into the program? As you may recall our previous publication showed that even with the 3 components all being at 90% the OEE would already be down to 73%. You may find that a more gradual slope to climb will help you scale the mountain a lot faster oddly enough. So, keep measuring and keep improving!! The struggle never ends!