 English

")

A few weeks ago, I was asked how to best go about the task of Task Duration Estimation (TDE) in projects.
There exists quite a body of literature on that subject and most of the authors have come up with some sort of categorisation scheme or other. It is thus certainly not the intent to make an exhaustive presentation on the subject here rather point the reader in a few directions that he or she may find helpful. Like a lot of items in Project Management TDE is -or surely should be- well-grounded in common sense and as such I have retained here only the following overview:
1) Analogous Estimating (AE)
Essentially this boils down to having a look at a similar project and see how long that took. It is often applied at a high level and is sometimes used as a top-down estimate. It obviously works best if the present envisaged project is very similar to the past one(s). It is a gross estimation approach and can be refined by applying the same technique the lower sub-tasks if these are known and then adding these together. As it is most suitable for high level estimates it can be of use for drawing up initial budgets when trying to get a feel for the expected cost and durations of the various phases of a project such as Scoping, Design, Construction & Operation.
2) Parametric Estimating (PE)
Here one tends to go one better than mere scaling off. One tries to mathematically link some historically known data or parameter to the new task. This works best if you have a Project Management Office (PMO) that has meticulously built up a treasure trove of data from past projects or other endeavours. This could be data on how many share meters per day a painter covers, how many km your cycling club tends to cover on their Sunday outings etc.… Obviously one would then be in a position to take a stab at working out the duration if you had 10 painters and you had to paint the South side of the Great Wall of China at Jinshanling or work out how long it would take for you to cycle the 2,500-mile-long Pacific Crest Bicycle Trail. This approach -if you have the data for it- is great for bottom up estimating and can produce fairly precise results.
3) Heuristic Estimating (HE)
Heurism is a fancy word for saying that you will be acquiring knowledge through empirical study and practical experience. And in the context of Project TDE that means applying judgment to get from the known point where we are now to the unknown point where the project stakeholders will presumably be most interested in. If we take a look at the two examples mentioned above how could that resonate through? Well, say that we now had to paint the Royal Albert Hall in London. That would involve quite a lot of nooks and crannies, numerous dye switches, etc.… possibly your PMO does not have such resolution in its data to cover all that… Or… our cycle team tends to ride a 42miles on flat terrain each Sunday.. can we really just divide 2,500 by 42 and think that will be a reasonable estimate? Probably not, … What about the ups & downs? What about the gravel roads? etc etc So what to do? Well, get into some Heuristic Estimating… meaning get a team who is ideally very close to the actual technical exception of the task to brain-storm on how the new expected characteristics will impact the duration (and/or cost). Obviously, as always when applying group-based techniques be conscious of group dynamics. Also, don’t be afraid to consult a singular expert as the other end of the spectrum. The expert may not only be able to draw your attention to where the historic data is not representative but may also be able to show you a suitable way on how to fudge or tweak the data generated algorithm to account for the newly phased conditions in the new project.
4) 3 Point Estimating (3PE)
All the above methods have somehow always implied that you would end up with one estimated duration. This is of course not the reality in most situations. More often than not you will end up with at least 3 estimates where you could make the following categorisations:
O: Optimistic value
P: Pessimistic value
M: Most likely value
Quite often in such circumstances people tend to just look at it as a mere gated approach and just going for the M value. This is in most cases not the best way forward as it does not take any of the information captured in the O & M values into account, which is also valid intel that should not just be discarded like that. A more sensible approach is for example the one used in the Program Evaluation and Review Technique (PERT):
TDE = (O + 4*M + P)/6
Essentially you are saying here that you give 4times as much weight to the M estimate as to the O & P values respectively. One could also give them equal weighting and replace the 6 by a 3, or you could come up with an infinite combination of weightings… But would that increase the accuracy of your estimate is what you have the ask yourself. It is always better to have a consistent yet possibly not perfect approach rather than an ever adjusted and thus inconsistent one.
Before we wrap up this post on estimation it is worth perhaps also saying a word or two on the use of historic data as input for your estimates. First of all, historic data points are just that. They are what happened in the past. Wat will happen tomorrow may not be the same as there may be other factors at play. What you are doing with your estimate on task duration is trying to predict the future. And as we all know making predictions -especially about the future- is hard. So how good should be your historic data then in order to have the best shot possible at doing just that? Well, here we walk in the statistical arena real fast. First of all, assuming that your past data is representative of your future task you would need to assess how man historic data points you would need to make any prediction adequately accurate. You can do this for continuous data such as task duration by using the below equation:
n = (1.96*STDEVP/E)^2
where
n is the required sample size;
1.96 is a constant used to indicate the 95% confidence interval;
STDEVP is the presumed standard deviation of the population, for example 2 days;
E is the margin of error, for example +/- 2 days;
When we do not know the population’s standard deviation, then you can make do with the range to know the standard deviation as an approximation. This approximation can be calculated by (max-min)/4. This does assume a normal-like distribution, which may not always be the case, but that is possibly something for another publication. 😉
You will find though that the required number for n tends to increase very rapidly. Suppose you have feedback data sets that vary in standard deviation from 1 to 16 days and you now want to see how many data points would be required in each of the data sets to have margins of error ranging from 1 to 4 days:
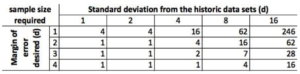
As can be seen, the numbers grow very fast It is a good idea though that whenever possible that even if the above equation gives you a number below 30 that you strive to have 30 as a minimum though. I say here “strive” as in real life you or your PMO may not have that luxury and you may be forced to make do with what you’ve got.
You will probably also have gotten the feeling that as you go down the above list they are to some extend all interrelated and the expected accuracy of the method applied tends to go up somewhat as you go down the list. This is a valid observation and all together not untrue. As a matter of fact, all you should be trying to do is arrive at a sufficiently accurate estimate without over-polishing the cannonball, though never forgoing an opportunity to gather data as it may in future serve you well.
Anyway, that’s all for now and roughly my two bits on Task Duration Estimation.
Feel free to visit us at www.maverick-enterprise.com and give us a thumbs up on facebook.
[/vc_column_text][/vc_column][/vc_row]